Understanding your kidney function markers over time with BioMedli
Kidney health is vital, and tracking key markers like creatinine and eGFR over time can provide valuable insights. Learn how BioMedli helps you organize your lab data, understand trends, and prepare for more informed discussions with your clinician about your kidney function.
June 14, 2026/6 min read
Kidney HealthCreatinineeGFRLongitudinal Data
BioMedli is for education and organization of health data. It does not diagnose disease, replace a clinician, or tell you what treatment is right for you.
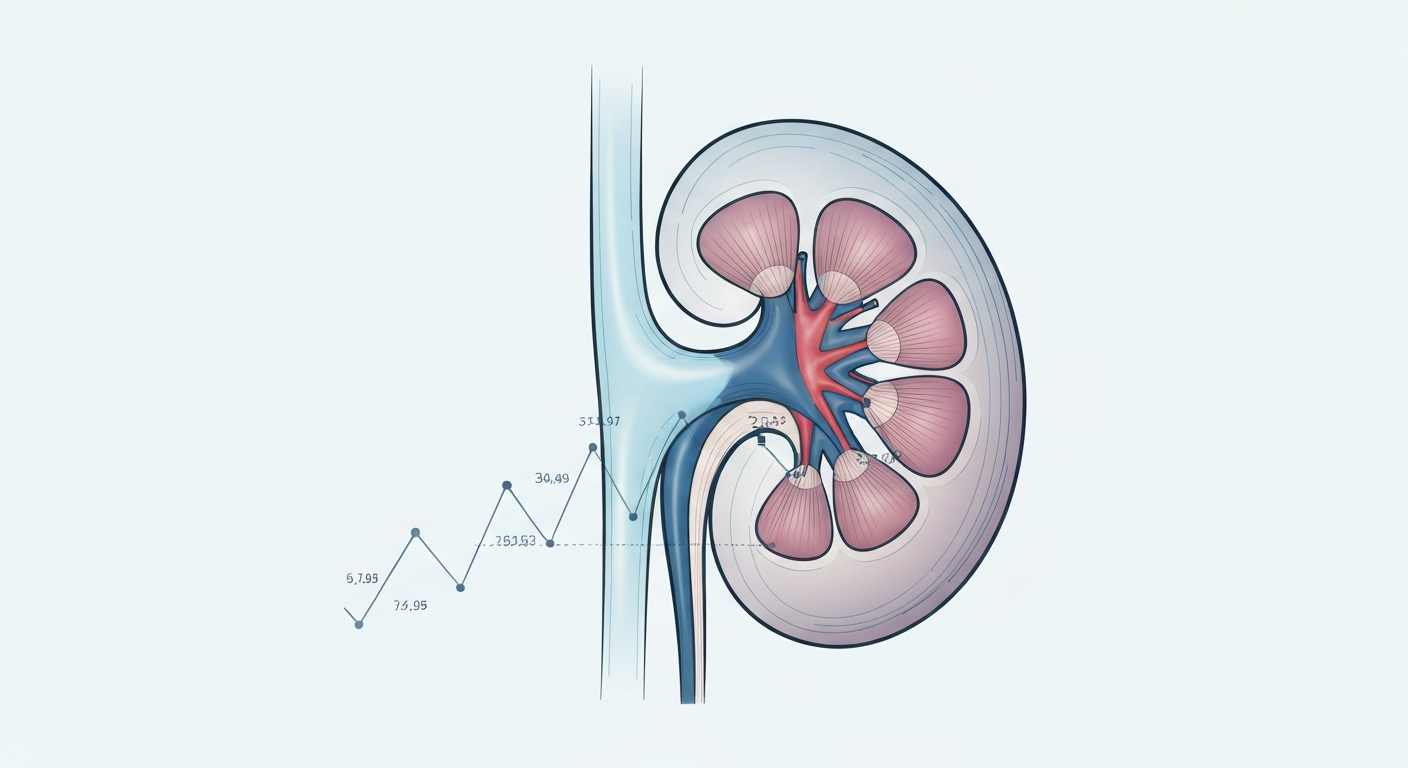
Your Kidneys: Vital Filters, Silent Workers
Your kidneys play a crucial role in maintaining your body's balance, filtering waste products from your blood, regulating blood pressure, and producing hormones. Because they often work silently even when their function begins to decline, tracking key kidney function markers over time becomes invaluable for understanding your health trajectory.
At BioMedli, we empower you to take control of your health data by easily uploading your blood report PDFs. This allows you to extract and organize critical biomarkers like creatinine and eGFR, preserving their unique units, dates, and reference notes. This longitudinal view can help you observe trends, not just isolated snapshots, offering a clearer picture to discuss with your healthcare provider.
What Are Key Kidney Function Markers?
Two primary markers are commonly used to assess kidney function:
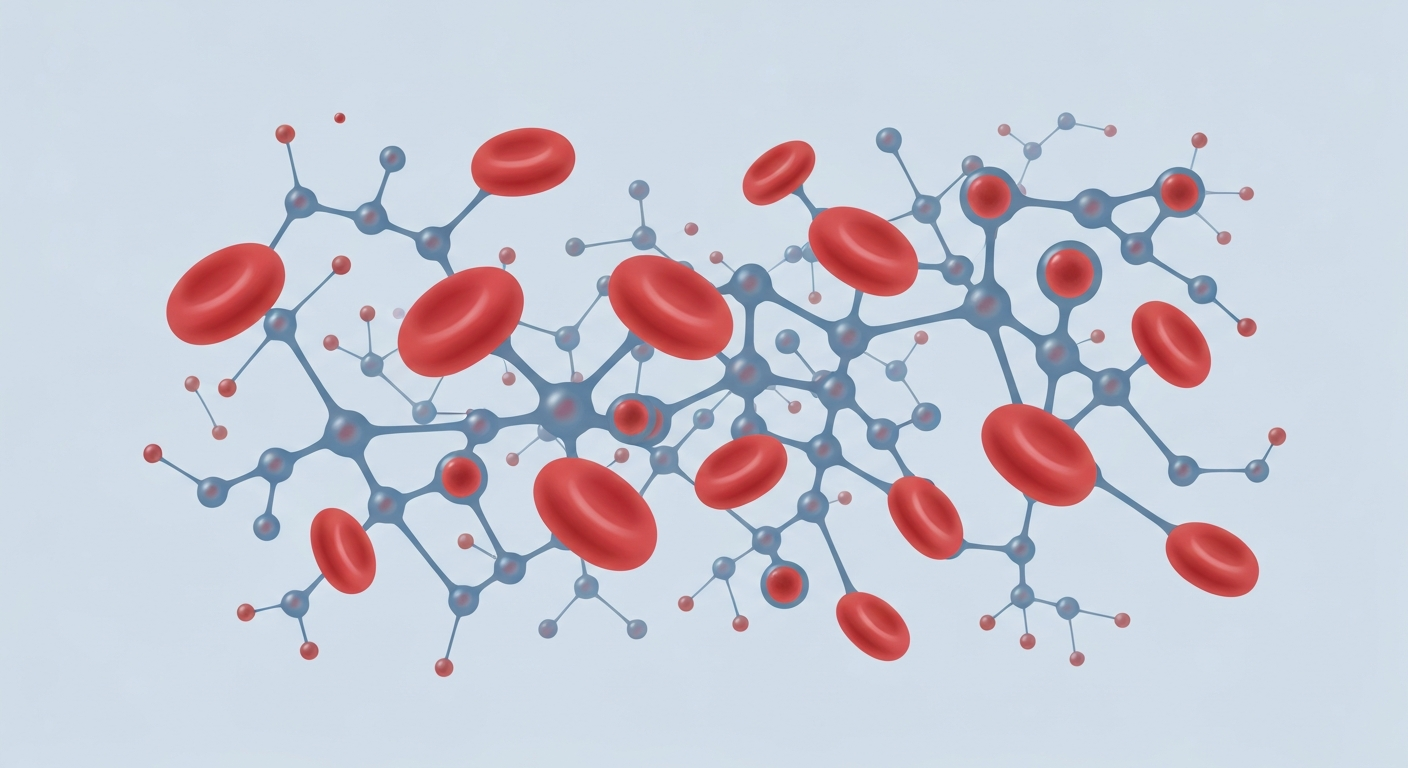
Creatinine: This is a waste product from normal muscle metabolism. Healthy kidneys filter creatinine efficiently, so its levels in the blood usually remain stable. Elevated creatinine can be a sign that your kidneys aren't filtering as effectively as they should.
Estimated Glomerular Filtration Rate (eGFR): This is a calculation, often derived from your blood creatinine level, age, sex, and sometimes race. eGFR provides an estimate of how well your kidneys are filtering waste from your blood. A higher eGFR generally indicates better kidney function, while a lower eGFR can suggest reduced function. Clinicians use eGFR as a primary indicator to stage kidney disease.
Why Tracking "Kidney Labs Over Time" Matters
Individual lab results are just one piece of the puzzle. The true power lies in observing how these kidney function markers change over months or years. A single slightly elevated creatinine or marginally low eGFR might not be significant on its own, but a consistent upward trend in creatinine or a steady decline in eGFR over several reports could indicate a change in kidney health that warrants closer attention and discussion with your clinician.
With BioMedli, every time you upload a new blood report PDF, the system automatically extracts your creatinine and eGFR values. It then plots these markers on intuitive graphs, allowing you to visualize your personal trends immediately. This organized history makes it easier to:
Spot patterns: Identify gradual changes that might otherwise go unnoticed.
Understand context: See how your markers relate to previous results and reference ranges.
Prepare for appointments: Bring a comprehensive, easy-to-understand history to your clinician, facilitating more productive conversations about your kidney health.
Remember, BioMedli is an educational and organizational tool designed to help you understand your data; it is not a diagnostic tool and does not provide medical advice. Always discuss your results and any concerns with a qualified healthcare professional.
Interpreting Your Trends: What to Look For
Understanding general trends in your creatinine and eGFR can help you formulate better questions for your doctor. Here’s a simplified overview:
Marker
General Trend
Potential Implication (Discuss with Clinician)
**Creatinine**
Increasing over time
May suggest declining kidney function
Stable over time
Typically indicates stable kidney function
**eGFR**
Decreasing over time
May suggest declining kidney function
Stable or increasing over time
Typically indicates stable or improving kidney function
It's important to note that many factors can influence these markers, including hydration status, diet, muscle mass, medications, and other health conditions. Your clinician will consider your full medical history when interpreting your specific results.
Empowering Your Health Conversations
Imagine walking into your doctor's appointment with a clear, chronological view of your kidney function markers over the past five years. Instead of relying on memory or scattered paper reports, you can present a consolidated trendline. This proactive approach can significantly enhance the quality of your health discussions and allow your clinician to make more informed recommendations for your care plan.
BioMedli's secure platform ensures that your sensitive health data, including units and reference ranges specific to each lab, is accurately preserved. This consistency is vital for proper trend analysis. Learn more about how BioMedli works to organize your health journey by visiting our /how-it-works page.
Organize Your Lab History with Ease
Ready to track your kidney function markers and other vital health data? Upload your blood report PDFs to BioMedli and start seeing your health trends clearly. It's simple, secure, and smart.
How often should I check my kidney function markers?
The frequency of testing depends on your individual health status, risk factors for kidney disease, and your clinician's recommendations. For some, annual checks may suffice, while others with existing conditions might need more frequent monitoring. Always follow your doctor's advice.
Can diet and exercise affect creatinine and eGFR results?
Yes, diet and exercise can influence these markers. For instance, consuming a lot of cooked meat or engaging in intense exercise before a blood test can temporarily raise creatinine levels. Significant changes in muscle mass can also affect creatinine. Always inform your clinician about recent dietary changes or exercise routines, and follow any pre-test instructions for accurate results.
Does BioMedli interpret my kidney function results for me?
No, BioMedli is an organizational and educational tool, not a diagnostic one. It helps you upload, extract, and visualize your **kidney function markers** like **creatinine and eGFR** over time, allowing you to observe trends. However, it does not interpret these results or offer medical advice. Always discuss your lab results and health trends with a qualified clinician.
Why is it important to track units and reference ranges from my lab reports?
Different labs may use slightly different units or reference ranges for the same biomarker, which can impact how results are interpreted. BioMedli preserves the original units, dates, and reference ranges from your uploaded PDFs, ensuring that your historical data is consistent and accurately reflective of the original lab findings, making it easier for your clinician to compare results over time.
Make your lab history easier to review
Upload reports, verify extracted values, and build a timeline you can discuss with your clinician.
Ever wondered about the difference between ferritin and iron on your lab report? We break down these key biomarkers, explain their distinct roles in your body, and show how BioMedli helps you track their trends calmly over time for more informed health conversations.
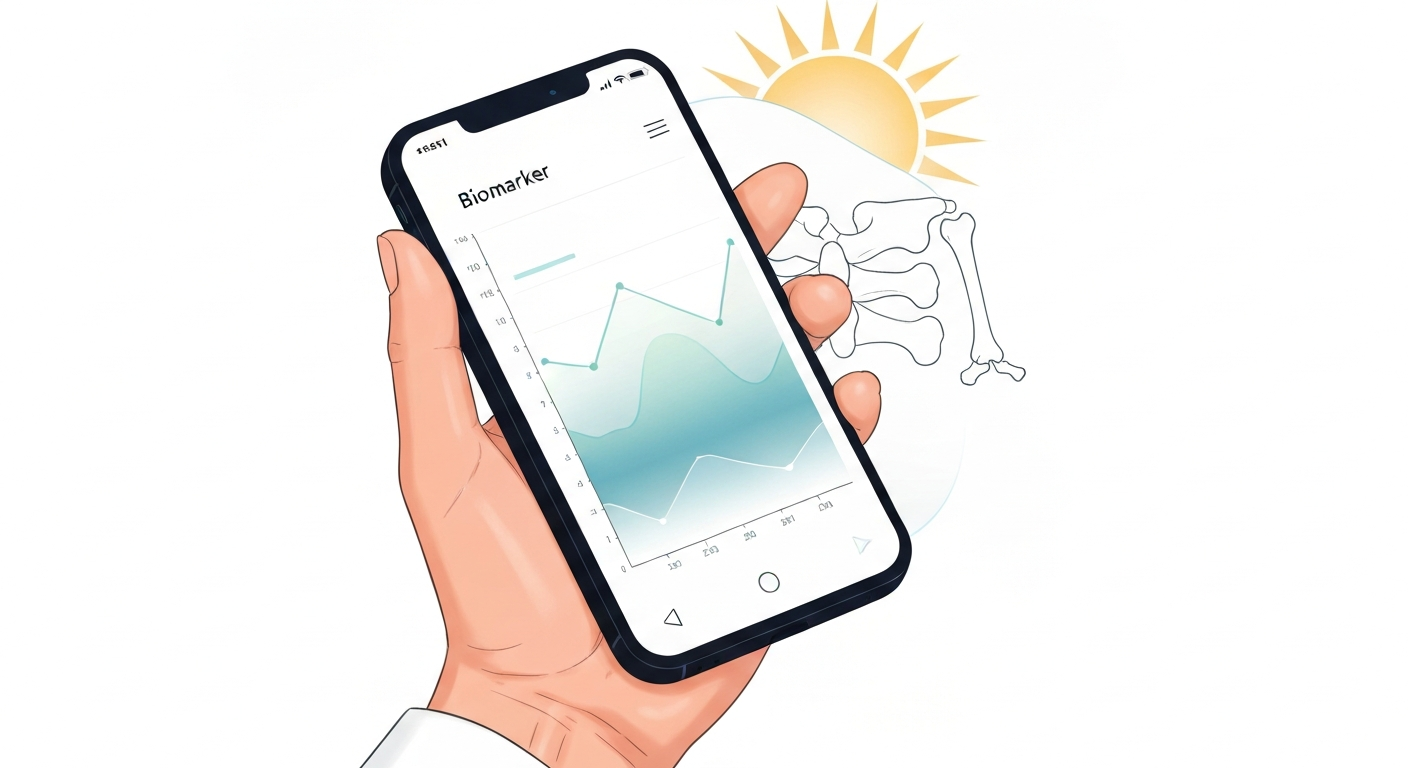
Demystify your vitamin D blood test results. Learn how BioMedli helps you track trends over time, understand lab reports, and prepare for informed conversations with your clinician, keeping your health journey organized and clear.
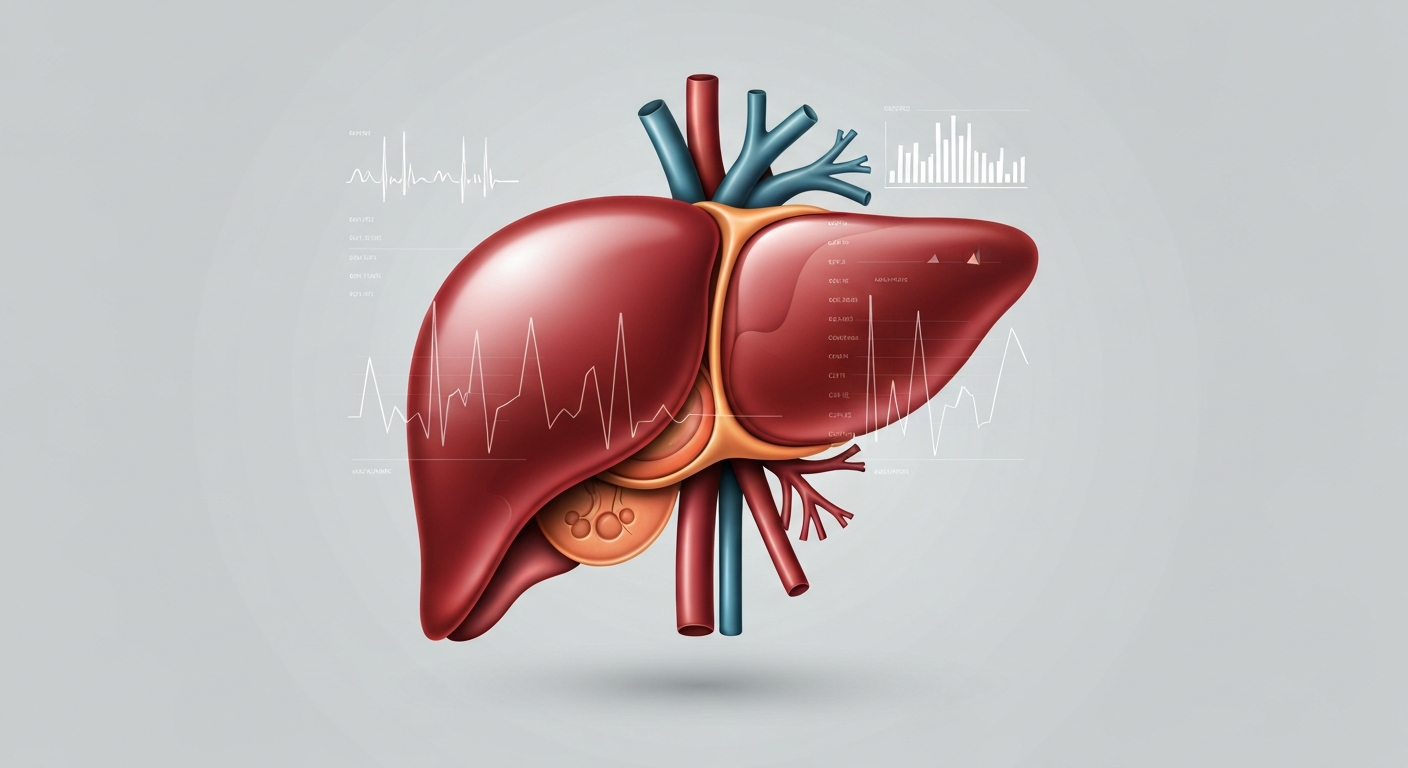
Understanding your ALT, AST, and GGT levels is key to monitoring liver health. Learn what these common liver enzymes indicate, how BioMedli helps you track their trends from your uploaded blood report PDFs, and why this data empowers better conversations with your clinician.